Why the debris catalog understates your risk
August 27, 2026
In late October 2025, a Spanish military communications satellite called SpainSat NG II left Cape Canaveral aboard a Falcon 9. It weighed a little over six tons and carried secure communications for Spain's armed forces, part of a program valued at roughly €2 billion. Two months into its climb toward geostationary orbit, still short of its final slot, something hit it.
What the something was, nobody can say. No warning had been issued, and the object was not in any operational catalog; its size and origin have not been made public. After days of investigation, the loss was attributed to an impact from an untracked object, and on January 16 the satellite was declared unrecoverable, never to enter service. The insurance market booked a loss of around $400 million against a day that, by every official surveillance metric, had been uneventful.
That is the state of orbital risk in 2026, in one satellite.
Space is much busier than it used to be
In January 2007, when China deliberately destroyed its defunct Fengyun-1C weather satellite and produced roughly 3,500 cataloged fragments, still the single largest breakup on record, fewer than a thousand active satellites were in orbit. Today ESA counts around 16,000. Most of that growth arrived in the last five years, driven by SpaceX's Starlink and a small number of constellations following behind it.
The debris record has grown too, but far more slowly: ESA logs an average of around ten significant fragmentation events a year, a couple of hundred over the past two decades. Set against a sixteenfold increase in traffic, that looks reassuring.
It is also, we now suspect, misleading.
What the catalog cannot see
The problem is one of resolution. The catalog holds fragments large enough for ground-based sensors to observe routinely, which in low Earth orbit means, as a rule of thumb, objects the size of a golf ball or bigger; the exact threshold shifts with altitude and sensor geometry. Below that threshold lies what the field calls the lethal non-trackable population: fragments below the floor of routine tracking and catalog maintenance, moving fast enough that small size makes little difference to what they do on impact. And the damage threshold sits far below the tracking one. Across Odin's operator assessments to date, the smallest particle capable of penetrating the bus has typically been around half a millimeter, with some spacecraft vulnerable down to 0.3 mm. One industry study attributes more than 95 percent of mission-ending collision risk to this invisible class.[^1]
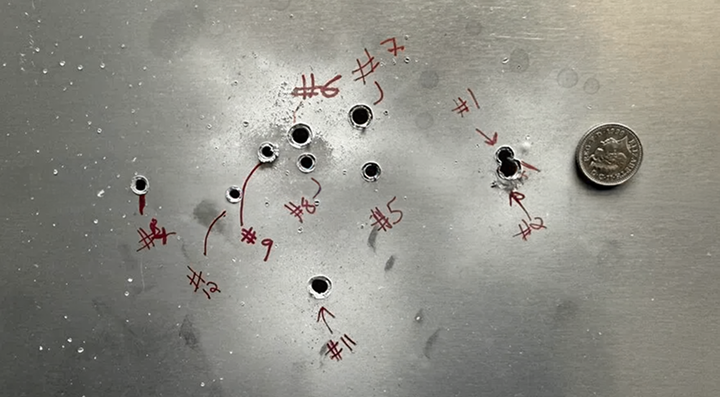
SpainSat NG II appears to have been lost somewhere inside that gap; the size of whatever hit it has never been established. Sentinel-1A was struck from inside it too: in 2016 an impactor around a centimeter across left a damaged patch some 40 centimeters wide on the solar array of ESA's flagship radar imager. The satellite survived, and its onboard camera caught the aftermath. Something similar happened aboard the ISS in 2021, when astronauts found a five-millimeter puncture through the thermal blanket of the Canadarm2 robotic arm during a routine inspection. In each case the object that mattered was invisible to the surveillance system operators rely on for collision warnings.
The patterns worth watching
The headline events are well known. The 2009 Iridium–Cosmos collision was the first accidental hypervelocity crash between two intact satellites. Russia's 2021 anti-satellite test sent the crew of the International Space Station into their return capsules. But the events that don't make international news are, in aggregate, more informative, because they reveal patterns.
Take the American weather satellites of the DMSP and NOAA families, which share battery hardware of a common design. Four of them, NOAA-16, NOAA-17, DMSP F11, and DMSP F13, have broken up in retirement, long after being passivated and supposedly inert. NASA's investigation board assessed battery rupture as the likely common thread, while noting its confidence was low.[^2] More recently, SpaceX's Starlink fleet has suffered its own fragmentations. In the March 2026 event, available reporting points to an internal energetic source as more likely than a collision.[^3] Note what it took to reach even that tentative conclusion. SpaceX had telemetry from thousands of near-identical spacecraft to compare against. Most operators fly no such control group.
For anyone pricing risk on a portfolio, these are not curiosities. The exposure that matters is correlated. Every spacecraft built on similar hardware, or flying the same regime, shares in the same bad news.
The lag
The catalog lags twice: it records debris only after an event has produced it, and it records only the fraction large enough to track. That double delay is why the record can look calm while the environment deteriorates. From 2007 through 2019, non-deliberate fragmentation events ran steadily at around ten a year.
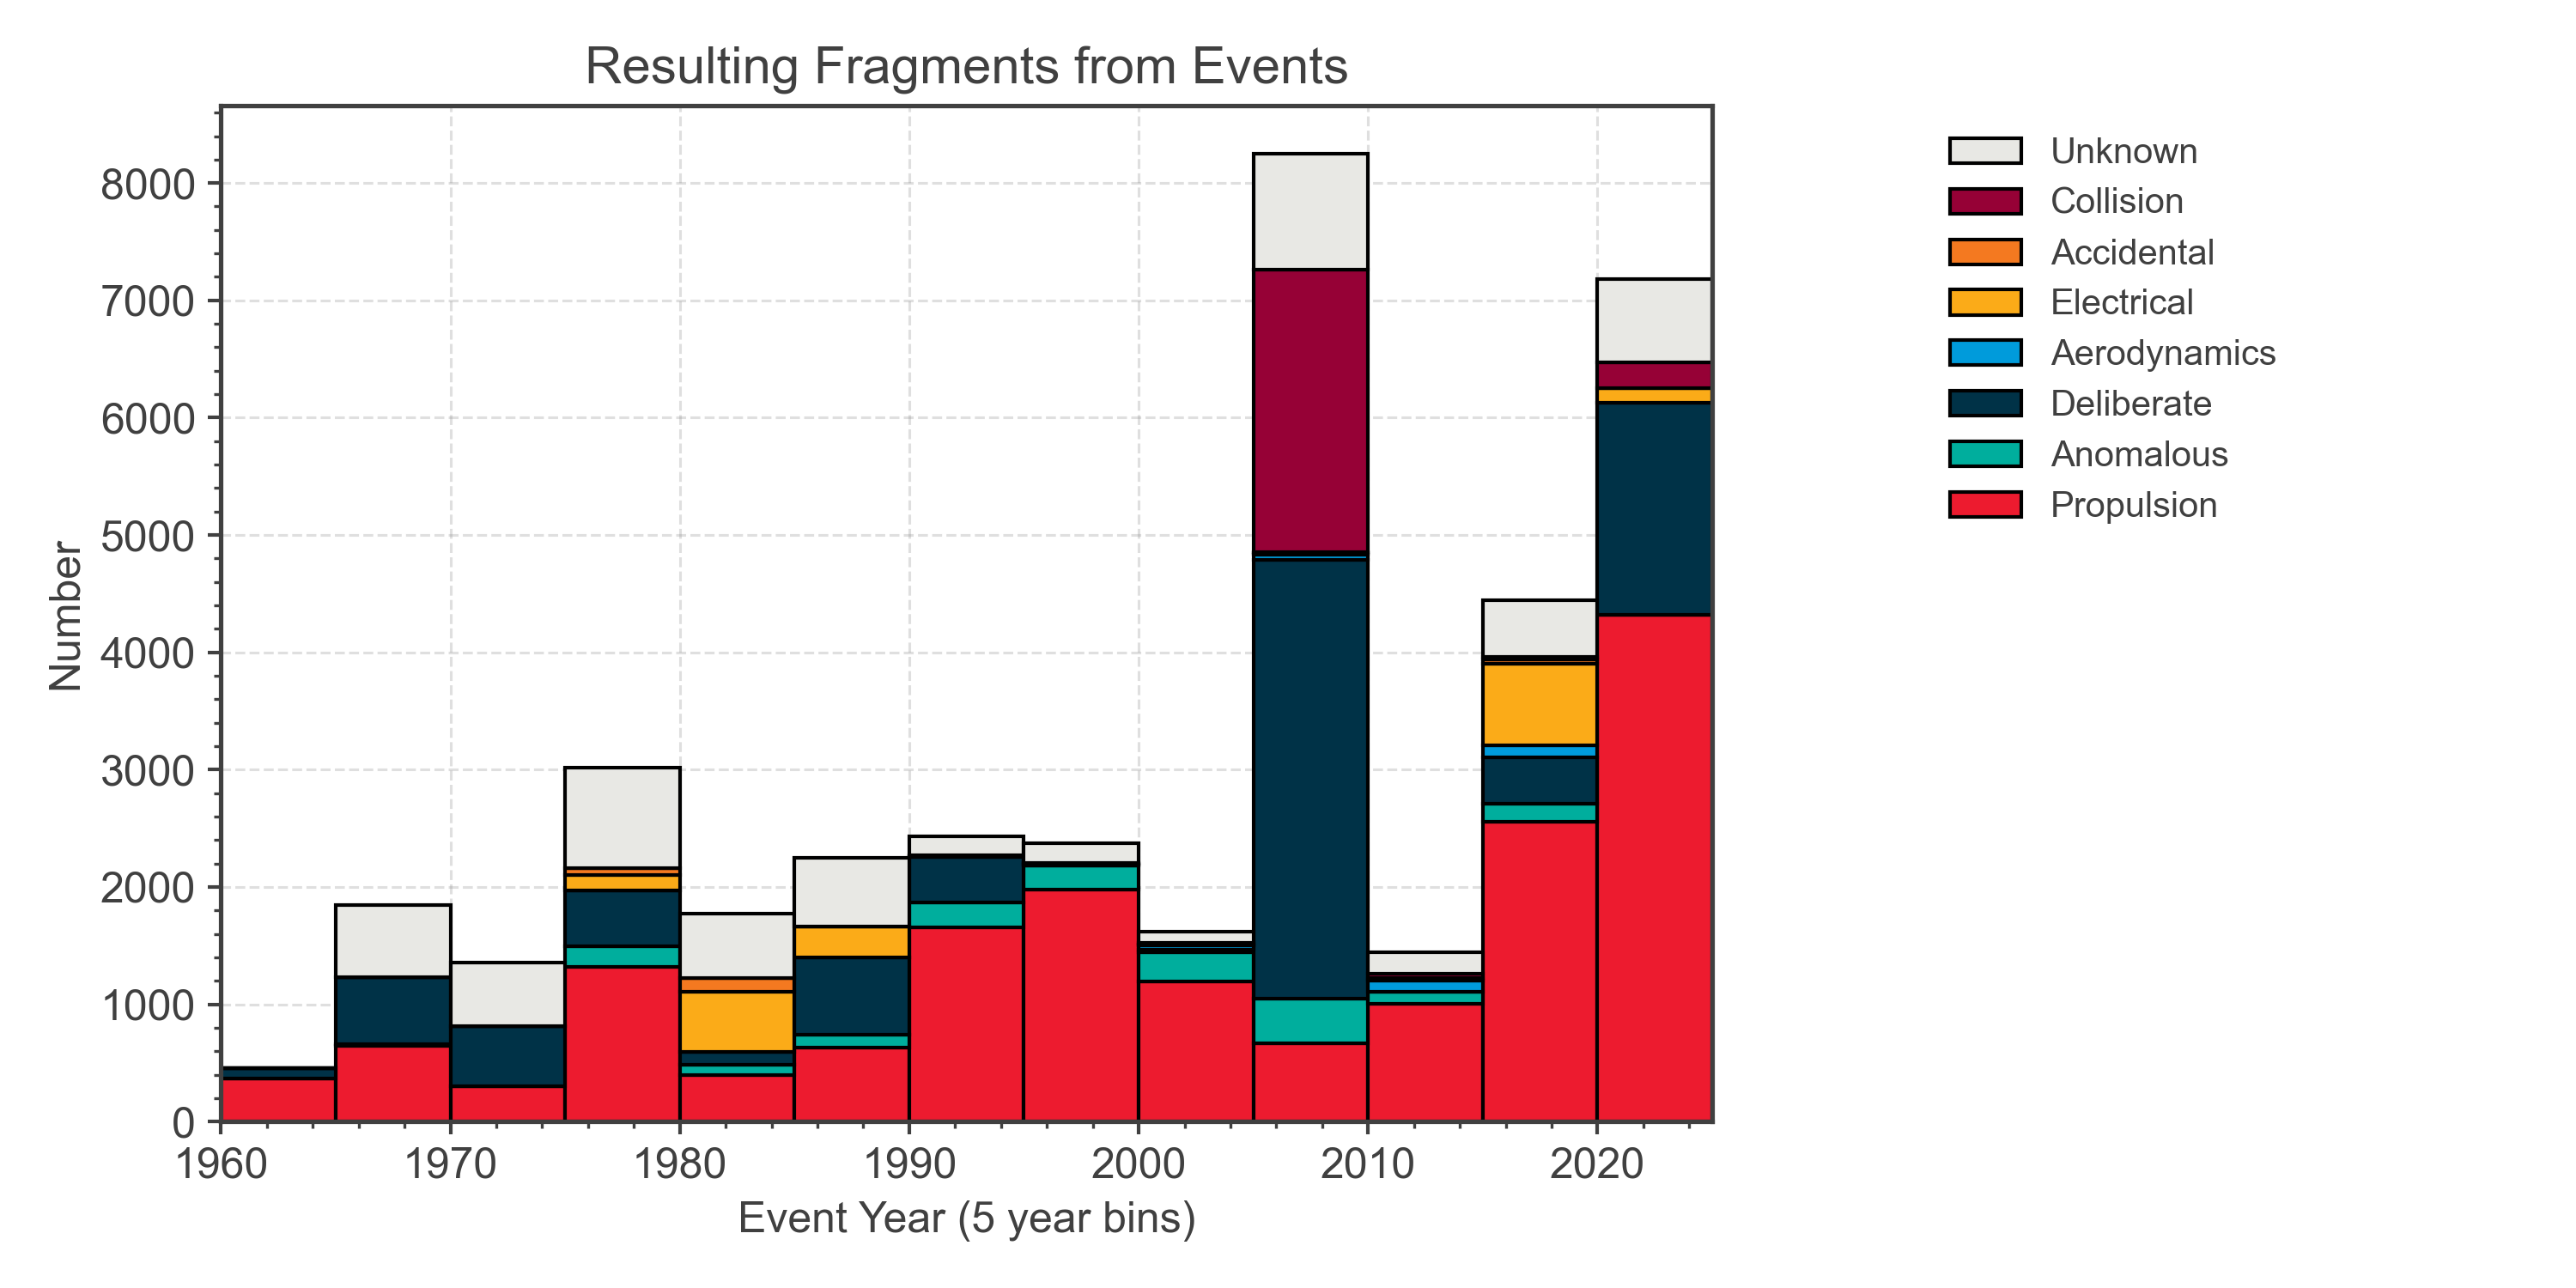
From 2020 onward, several new phenomena have appeared more or less at once. Recurring upper-stage breakups from more than one vehicle family, notably China's Long March 6A, which has shed debris near 800 kilometers repeatedly since 2022 with no publicly resolved cause. The first publicly observed fragmentations within a mega-constellation fleet. The breakup of a large operational geostationary satellite, Intelsat 33e, in October 2024. A suspected impact in the geostationary graveyard region, the Russian Luch/Olymp spacecraft, in January 2026, still under investigation. And SpainSat NG II.
None of these events, taken alone, is unprecedented. Together they suggest something less comfortable: the debris signal is beginning to catch up with a traffic environment that stepped up six or seven years ago and has not yet stabilized. A collision today throws off fragments that keep circling for years, which means the risk environment of the 2030s is being written now, by a launch rate that keeps setting records. The catalog will report it, faithfully, afterwards.
Three numbers that lead instead of lag
So if the catalog is a rearview mirror, what should an operator, or an underwriter, actually watch? Three indicators, each more telling than the raw object count.
Density, by shell. What matters is how many spacecraft occupy your altitude band, and how fast that number is growing. A shell whose population has multiplied in three years has outgrown its own safety record; the historical rate is true and useless at the same time.
Fragmentation frequency and severity. How often things are breaking up, where, and how energetically. A breakup one shell away can change the flux through a constellation within weeks. The catalog may record the larger fragments quickly, but it cannot reveal the smaller population carrying much of the risk. Fragment counts follow a power law, so the bulk of every breakup disappears below the tracking threshold.
The gap between the catalog and the population. Surveillance networks maintain catalog data on roughly 46,000 objects. ESA's models estimate about 1.2 million fragments between one and ten centimeters, and upwards of 130 million smaller still. The comparison does not translate directly into collision probability, but it shows how much of the environment sits beyond routine avoidance, and every new collision pushes it the wrong way.
Public data reveals the first. It offers only a partial view of the other two: at the sizes most likely to end missions, the population has to be measured from orbit itself.
What we're doing about it
If most mission-ending impacts come from objects the catalog cannot see, then the risk model needs a different measurement layer. Odin Space is building it. The Odin Black Box is a compact sensor unit mounted on the host spacecraft; its impact instrument establishes that an external strike occurred, where on the structure it happened, and how severe it was. Odin’s roadmap adds Outpost satellites carrying the same sensing technology as dedicated monitors in the busiest orbits. Both feed Odin Overwatch, the service that gives operators and insurers a direct read on the debris environment their exposure actually depends on. The catalog can warn an operator about the objects it knows. Odin measures the peril that remains, and supplies the evidence required to price and insure it.
Odin Space measures the sub-catalog debris population from orbit, where it can be measured. If any of the above is a question on your desk, contact us to find out more.
Odin Space provides in-orbit impact data and does not underwrite insurance. Collision cover referenced here is underwritten through Lloyd's of London and arranged through the regulated broker WTW.
[^1]: HDI Global Specialty, space debris study, 2023: more than 95% of mission-terminating collisional risk is attributed to lethal non-trackable debris.
[^2]: NASA, NOAA-17 Breakup Engineering Investigation Board final report, 2024, covering the related NOAA-16, NOAA-17, DMSP F11, and DMSP F13 breakups.
[^3]: NASA Orbital Debris Program Office, Orbital Debris Quarterly News (Long March 6A breakups, 2022 and 2024); industry reporting on the March 2026 Starlink fragmentation event.
Additional sources: ESA Annual Space Environment Report; ESA space environment statistics (2026); ESA MASTER-8 model; NASA Orbital Debris Program Office; Hisdesat/Indra public statements on SpainSat NG II, January 2026; ESA Sentinel-1A impact analysis (Krag et al., 2017).